Converging Monoid Addition for T-Digest
In the days when Sussman was a novice, Minsky once came to him as he sat hacking at the PDP-6. “What are you doing?”, asked Minsky. “I am training a randomly wired neural net to play Tic-tac-toe”, Sussman replied. “Why is the net wired randomly?”, asked Minsky. “I do not want it to have any preconceptions of how to play”, Sussman said. Minsky then shut his eyes. “Why do you close your eyes?” Sussman asked his teacher. “So that the room will be empty.” At that moment, Sussman was enlightened.
Recently I’ve been doing some work with the t-digest sketching algorithm, from the paper by Ted Dunning and Omar Ertl. One of the appealing properties of t-digest sketches is that you can “add” them together in the monoid sense to produce a combined sketch from two separate sketches. This property is crucial for sketching data across data partitions in scale-out parallel computing platforms such as Apache Spark or Map-Reduce.
In the original Dunning/Ertl paper, they describe an algorithm for monoidal combination of t-digests based on randomized cluster recombination. The clusters of the two input sketches are collected together, then randomly shuffled, and inserted into a new t-digest in that randomized order. In Scala code, this algorithm might look like the following:
def combine(ltd: TDigest, rtd: TDigest): TDigest = {
  // randomly shuffle input clusters and re-insert to a new t-digest
  shuffle(ltd.clusters.toVector ++ rtd.clusters.toVector)
    .foldLeft(TDigest.empty)((d, e) => d + e)
}
I implemented this algorithm and used it until I noticed that a sum over multiple sketches seemed to behave noticeably differently than either the individual inputs, or the nominal underlying distribution.
To get a closer look at what was going on, I generated some random samples from a Normal distribution ~N(0,1). I then generated t-digest sketches of each sample, took a cumulative monoid sum, and kept track of how closely each successive sum adhered to the original ~N(0,1) distribution. As a measure of the difference between a t-digest sketch and the original distribution, I computed the Kolmogorov-Smirnov D-statistic, which yields a distance between two cumulative distribution functions. (Code for my data collections can be viewed here) I ran multiple data collections and subsequent cumulative sums and used those multiple measurements to generate the following box-plot. The result was surprising and a bit disturbing:
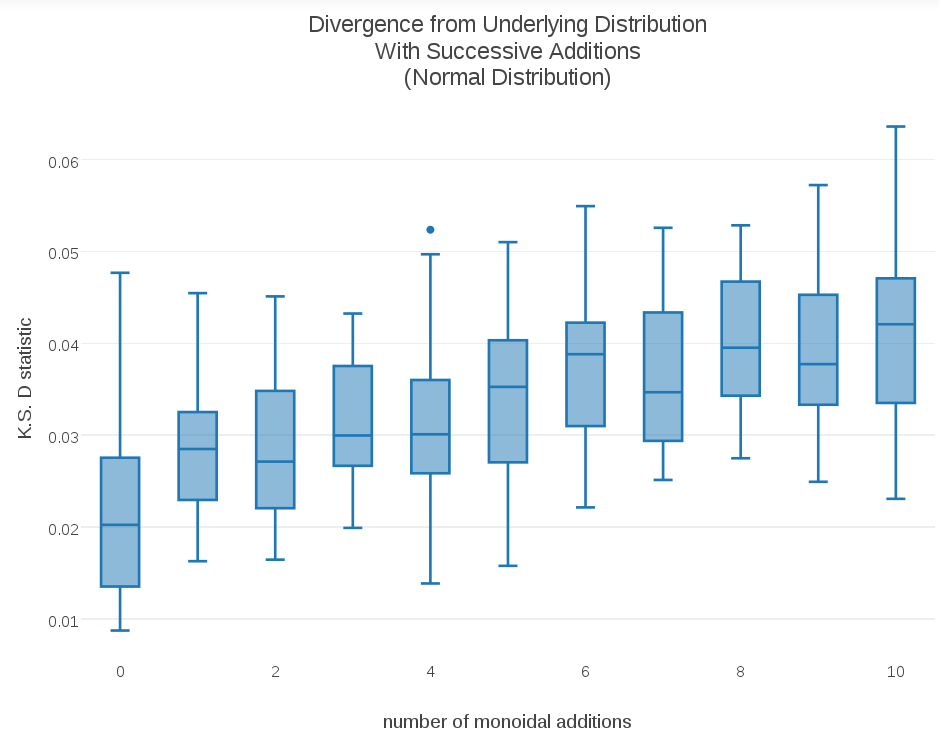
As the plot shows, the t-digest sketch distributions are gradually diverging from the underlying “true” distribution ~N(0,1). This is a potentially significant problem for the stability of monoidal t-digest sums, and by extension any parallel sketching based on combining the partial sketches on data partitions in map-reduce-like environments.
Seeing this divergence motivated me to think about ways to avoid it. One property of t-digest insertion logic is that the results of inserting new data can differ depending on what clusters are already present. I wondered if the results might be more stable if the largest clusters were inserted first. The t-digest algorithm allows clusters closest to the distribution median to grow the largest. Combining input clusters from largest to smallest would be like building the combined distribution from the middle outwards, toward the distribution tails. In the case where one t-digest had larger weights, it would also somewhat approximate inserting the smaller sketch into the larger one. In Scala code, this alternative monoid addition looks like so:
def combine(ltd: TDigest, rtd: TDigest): TDigest = {
  // insert clusters from largest to smallest
  (ltd.clusters.toVector ++ rtd.clusters.toVector).sortWith((a, b) => a._2 > b._2)
    .foldLeft(TDigest.empty(delta))((d, e) => d + e)
}
As a second experiment, for each data sampling I compared the original monoid addition with the alternative method using largest-to-smallest cluster insertion. When I plotted the resulting progression of D-statistics side-by-side, the results were surprising:
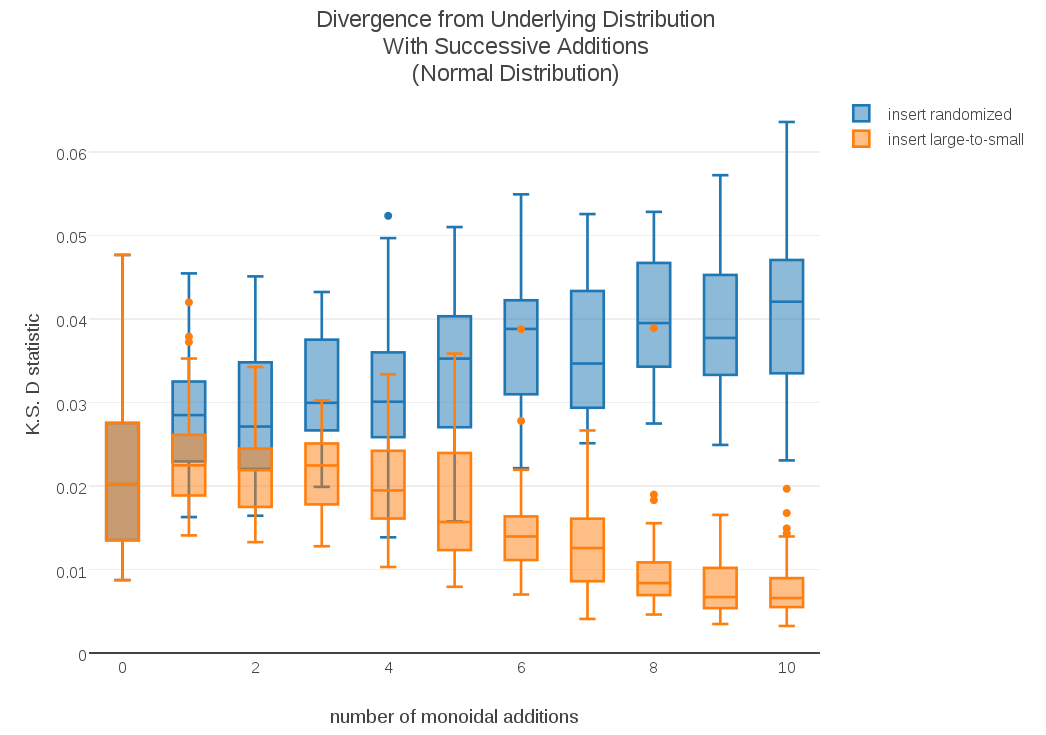
As the plot demonstrates, not only was large-to-small insertion more stable, its D-statistics appeared to be getting smaller instead of larger. To see if this trend was sustained over longer cumulative sums, I plotted the D-stats for cumulative sums over 100 samples:
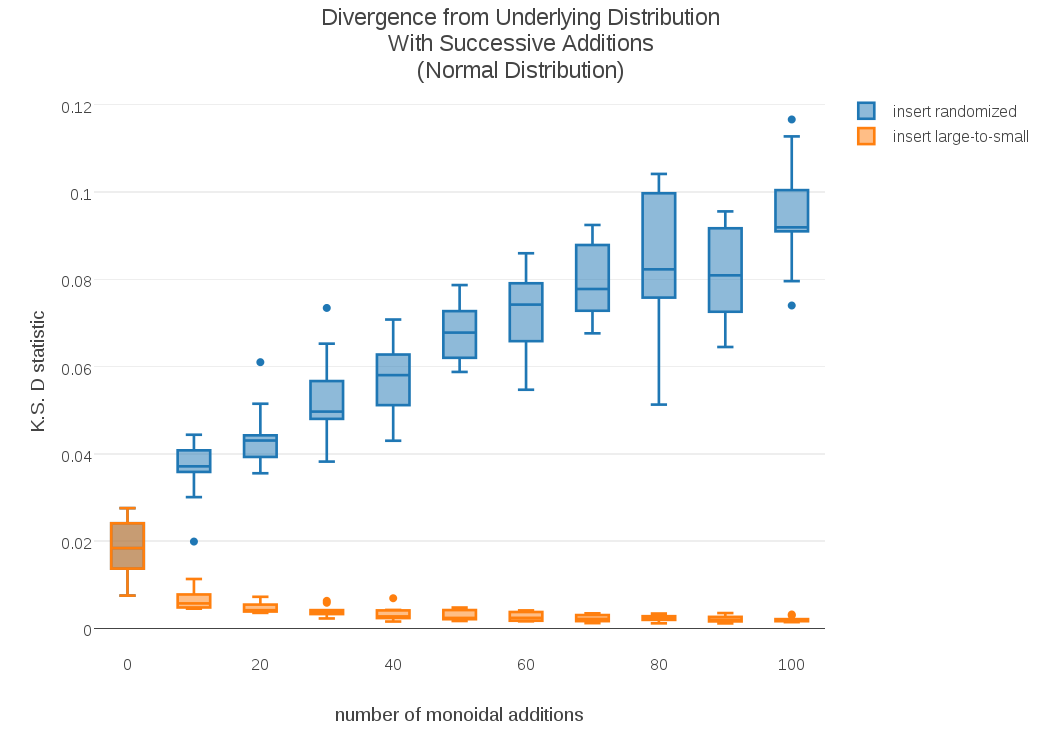
The results were even more dramatic; These longer sums show that the standard randomized-insertion method continues to diverge, but in the case of large-to-small insertion the cumulative t-digest sums continue to converge towards the underlying distribution!
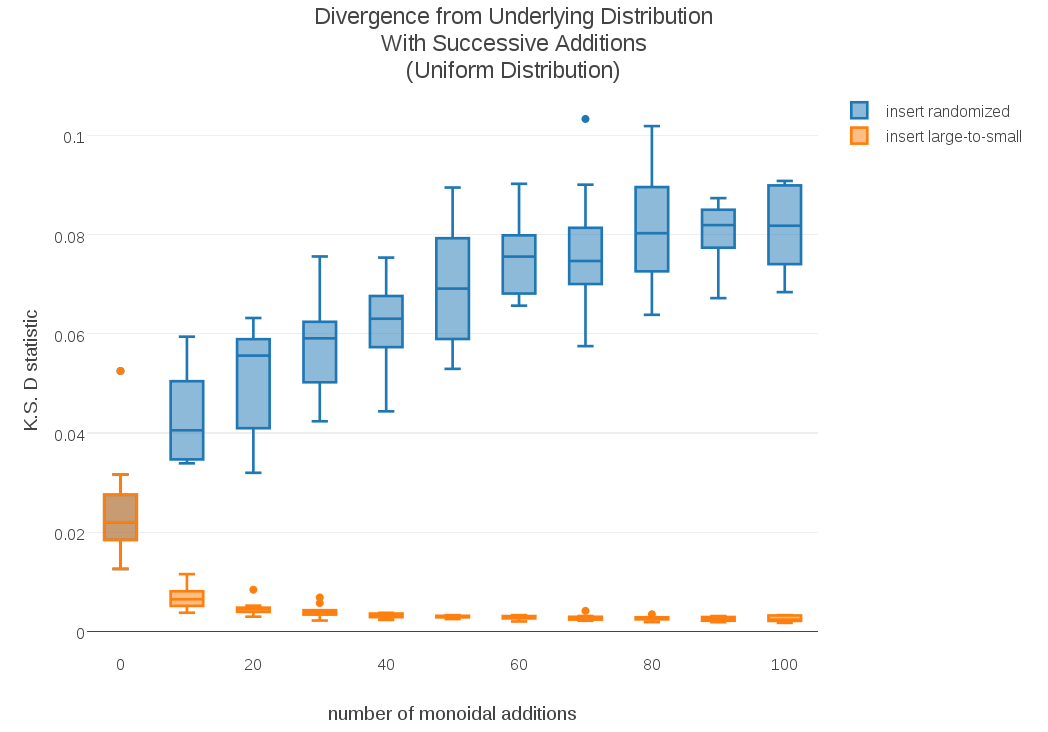
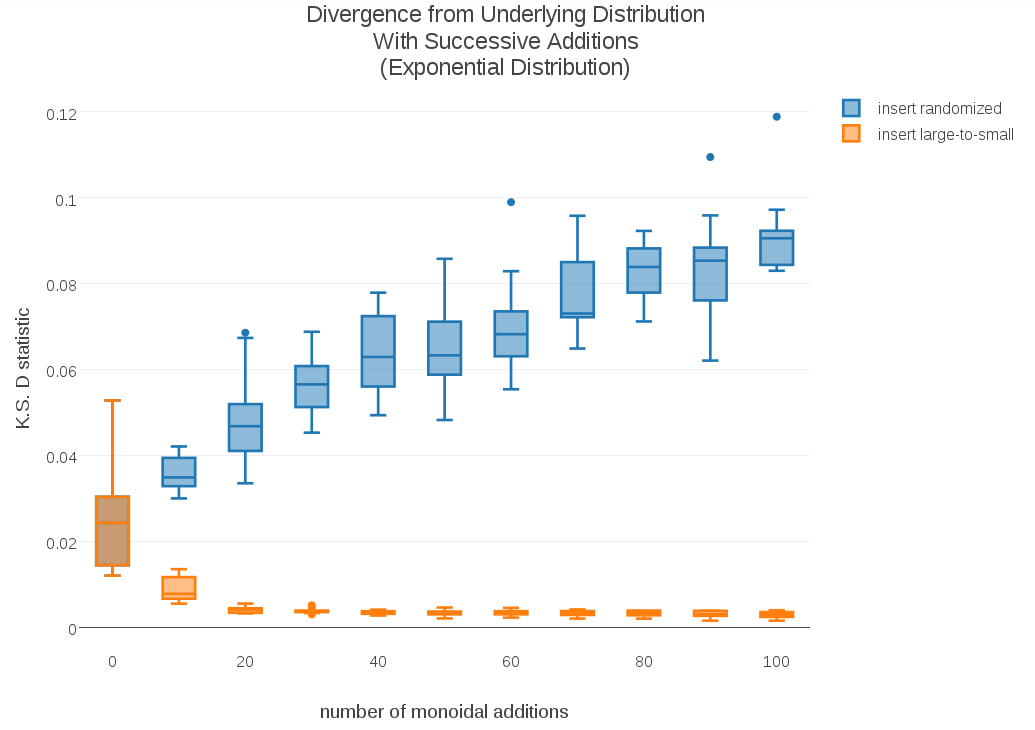
To test whether this effect might be dependent on particular shapes of distribution, I ran similar experiments using a Uniform distribution (no “tails”) and an Exponential distribution (one tail). I included the corresponding plots in the appendix. The convergence of this alternative monoid addition doesn’t seem to be sensitive to shape of distribution.
I have upgraded my implementation of t-digest sketching to use this new definition of monoid addition for t-digests. As you can see, it is easy to change one implementation for another. One or two lines of code may be sufficient. I hope this idea may be useful for any other implementations in the community. Happy sketching!
Appendix: Plots with Alternate Distributions